
My last few articles on bus sniffing the IBM 5150 have been building up to this one. We’re going to leverage our bus sniffer and sniffer decoder to finally debug Area5150’s “Lake” effect.
Yes, it does, but I have a dirty little secret I need to confess to the world. Despite all the accolades MartyPC has received about being super-accurate, it needed a special, Area5150 specific hack in order to run the final two cycle-counted effects, “Wibble” and “Lake.” “Wibble” is the scene with Charlie Chaplin, the green fellow and the elephant. “Lake” is the final end credits scene with the water effect and the PCM audio player.
In other words, I cheated.
It haven’t actually tried that hard to keep it hidden, as you can see if you are watching the console while MartyPC runs:
Okay, maybe I’m being a bit hard on myself. Title-specific hacks are nothing new to the world of emulation. Historically, many famous emulators have relied on title patches to work around bugs or inaccuracies to get games to play. As emulators have improved in accuracy and research has uncovered more details about how systems work, gradually these title hacks became less necessary.
In my defense, MartyPC has always ran the effect itself cycle-accurately once the effect actually starts – it’s just starting the effect in the first place that is the real trick. In this article I’ll show you why, and what I did to fix it.
Part of what makes Area5150 (and 8088MPH before it) so mind-blowing, is not necessarily that it does any effects new to the demoscene, but that it does them on the IBM CGA, something never previously thought possible.
The IBM CGA adapter was a very limited device. It was ill-suited for games, and one of the reasons why was a lack of a vsync interrupt. Other computer systems and most video game consoles have some sort of interrupt that triggers either per frame or multiple times per frame, to signal a running program or game that the CRT’s raster was in some known position on screen. This would be useful for example if you didn’t want to draw or erase things in video memory while the screen was scanning out – doing so would lead to flicker, or in the CGA’s worst case, visual artifacts on screen (snow).
The latter condition is vitally important to Area5150, as the vast majority of its effects are performed in 80 column text mode where snow is a looming concern. Every effect in the demo, therefore, must be careful not to access video memory outside of the horizontal and vertical blanking periods. Other effects must precisely update the video memory start address each scanline. How do they do this, then?
Since we have no interrupt available, the most straightforward way to determine where we are on the screen is via polling of the CGA’s status register at 03DAh. Within the status register are two bits of interest. Bit 3 tells us whether we are in a vertical blanking period. Bit 0 is the CRTC’s “Display Enable” line, inverted. When this bit is set, the beam is somewhere outside the visible display area. This isn’t necessarily horizontal blank, but it includes all areas out of the “display rectangle”, either hblank, vblank, or overscan areas.
There’s not enough space here to go into detail about how CRTC screen geometry works, but if you’re interested, I plan to do a future deep-dive into the CGA. I’ll get in my time machine and put a link here when that is written!
One of the tricks MartyPC does to achieve a high level of CGA accuracy is what I call dynamic clocking – basically, when a write to one of the CGA’s registers occurs during an instruction, the CGA is ticked at full resolution – 14Mhz, until the update is complete, and then after until we catch back up with the CGA’s character clock, where the CGA can resume drawing 8 pixels at a time. This gives us the cycle-accuracy needed for Area5150’s demanding effects without requiring the emulated CGA to always be ticked every system clock tick.
We can take advantage of this “catching up” phase to visualize polling. Let’s take an effect from Area5150 that performs scanline polling in order to set the video memory start address each scanline. We can override the emulator color to magenta when one of these IO operations is in progress:
This is a special debug view of MartyPC that shows the entire display field – hblank in green and vsync in yellow, here. It’s easy to see the furious pace of the effect’s polling for the CGA status register. It’s hard to do anything else while we’re polling this fast, which limits the complexity of any demo effect that requires it.
The Lake effect requires per-scanline start address reprogramming, but it doesn’t poll the CGA status register in the main effect itself. Given the complexity of what it needs to do – displaying the credit graphics, implementing the water ripple effect, and playing sound – there simply isn’t enough time to be constantly reading port 3DA.
So instead, the effect is cycle-counted, similar to the Kefrens bars effect from 8088MPH. The idea behind racing the beam is that rather than trying to ascertain where they are on the screen at any given time via polling, the programmer can work out where they are on screen by measuring the number of CPU cycles the code takes. Due to the shared system clock between the CPU and CGA on the IBM PC, one CPU cycle equals 3 pixels (or ‘hdots’) exactly on a CGA display. So if we can start from a known frame of reference, and we know how long our code takes, then we should know exactly where the raster beam is at any given instruction. Easy, right?
The second part of this trick is precisely controlling what is displayed from scanline to scanline – we set Vertical Total to the minimum value of 1, which effectively creates a two pixel tall screen. We can control the starting address of this ‘mini screen’ to achieve various effects, and if we program the Vertical Sync position to something greater than Vertical Total, we prevent VSYNC from happening.
A good way to understand this technique is to consider what happens if we simply reprogram Vertical Total twice per frame:
When the CRTC reaches Vertical Total, it thinks it is done drawing the entire screen, and latches the start address again. This allows us to display two separate regions of video memory on the screen at the same time. What the Lake effect does is simply take this technique to its logical extreme.
Normally, this trick only allows us to have a unique start address for every two scanlines – being that the minimum height of a frame from the CRTC’s perspective is two logical rows. The Lake effect manages to set a new start address every single scanline, by placing those two logical rows side by side.
How does it do this? By furiously reprogramming the CRTC chip, 8 times per scanline.
In this fashion, the code is in precise control of every scanline and every pixel displayed, simply by having the code execution in perfect lockstep with the scan-out of the display. Pretty incredible, right?
Lake is only partially cycle-counted. The graphics are drawn first in perfect lockstep with the CGA, but then the audio is processed in a non-cycle counted manner after the end of the display area. This raises an issue – if we stop counting cycles precisely, we lose track of where we are on screen, and the effect needs to begin at the same exact pixel every frame. So how do we account for this?
Rolling Your Own VSYNC Interrupt
Just because the CGA hardware doesn’t provide a VSYNC interrupt, doesn’t mean you can’t make one. Timer channel 0 of the Intel 8253 Programmable Interval Timer is typically used by the BIOS to maintain the system clock, but nothing prevents a programmer from stealing it for their own purposes, which many games and applications do. Timer channel 0 is connected to IRQ0, which by convention is mapped to interrupt 8h. If you place the address of a routine at the 8th slot in the interrupt vector table, you can have it called every time your timer counts down to 0. This lets you execute code at somewhat-precise intervals.
I say somewhat-precise, because interrupts cannot actually interrupt an instruction in progress, an interrupt only fires off when an instruction is finished and interrupts are not somehow suppressed (like, for example, if the Interrupt CPU flag is disabled, or you just fiddled with a segment register). This means our interrupt may be delayed by a variable amount depending on the length of the CPU instruction executing when it fires off. One way to address this is simply to execute the HLT instruction when we are done processing and want to wait for the next interrupt trigger. HLT will stop the CPU until the next interrupt occurs, and it wakes up in a much more precise manner.
Since the IBM PC has a single clock, the timer’s control clock is also just a divisor of the system clock, in this case a divisor of 12. The derivation for the timer clock is (315/22)/12 or 1.1931Mhz. This means one pixel/hdot every 12 timer ticks. The timer works by accepting a reload value, which it counts down from toward 0 every timer clock tick.
A normal CGA screen is 912 hdots * 262 scanlines or 238944 hdots. This means if we give our timer a reload value of 238944/12 or 19912, we will get a timer interrupt at precisely the same position on screen every frame.
The only trick is setting the timer at the right time for this to be useful. Some initial polling is required. A typical polling sequence might work as follows:
- Read the value of 3DA.
- If the vsync bit is set, poll 3DA until it is not set.
- Poll 3DA until the vsync bit is set.
- Poll 3DA until the vsync bit is no longer set.
After this sequence, we can be fairly sure we are some short period immediately after a vsync has completed, i.e., we have just started a new frame. We can then quickly program timer channel 0, and we’ll have our vsync interrupt – at least, one delayed by the time it takes to perform the IN and OUT instructions needed to both poll status and program the timer.
If you’re racing the beam, however, this may not be what you want, especially if you want to start at the beginning of a visible frame. The end of vsync means we are in the top overscan area – not in a visible part of the screen. So a further polling loop is required, polling 3DA until bit 0 flips from 1 to 0, indicating we are now in the display area.
But again, we can only detect this condition after it happens, and there will be a delay induced by the time spent setting up timer channel 0.
What if you needed a vsync interrupt at precisely the start of the display area? Or worse – what if you needed the interrupt to fire just before the start of the display area? And what if you needed it to fire with pixel precision?
Lake Effect ISR Setup
As it turns out, the answer to this question is not easily. Lake uses no fewer than eight separate timer interrupt service routines in a chain in order to precisely position the final interrupt service routine that runs the main effect.
The final interrupt must trigger very precisely:
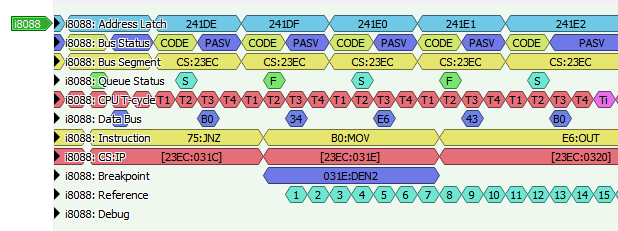
If we count scanlines starting at 0 as we leave VSYNC, this is the end of scanline 20. If we count columns starting at 0 as we leave HSYNC, it’s approximately column 723. It’s important to note that this is just when the interrupt fires – when the INTR line to the CPU goes high. The actual effect ISR is delayed by several cycles. Let’s look at the sniffer trace to see the timing:
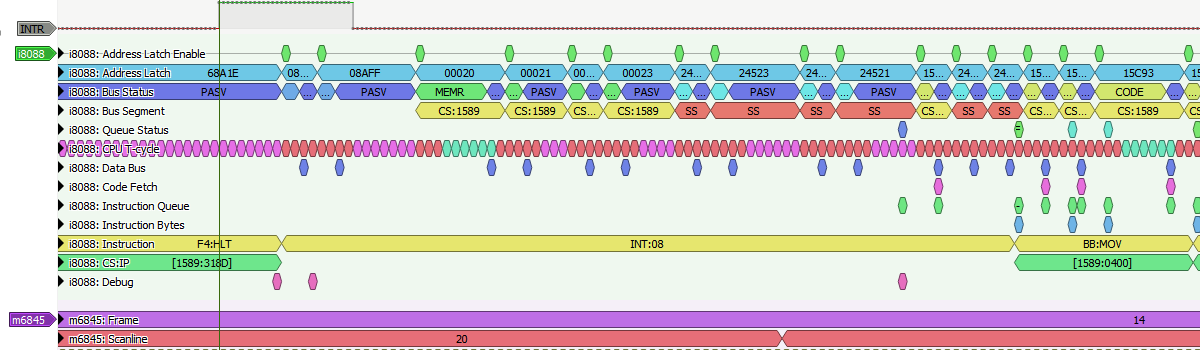
The vertical marker indicates the rising edge of INTR. Notice that we don’t wake up from HALT instantaneously; it takes a few cycles for our slumbering CPU to get its act together, in this case 7 cycles. And even then our ISR has to wait for two INTA bus cycles, and fetching of the ISR address from the IVT – a process that in turn, is interrupted by DRAM refresh DMA (note the CPU wait states in cyan). It isn’t until 90 cycles later that we actually begin the ISR with our MOV instruction. That’s 30 hdots, if you’re keeping track, long enough that we roll through HBLANK entirely and wind up on the next scanline down, 21, exactly one scanline above the start of display enable. The effect uses this first scanline to set up the CRTC registers, then the actual effect begins on the next scanline and continues for the next 200 scanlines.
Thankfully, the first four interrupts in this chain have more to do with synchronizing the various clocks in the system – a technique known as achieving lockstep – than they do with positioning the effect interrupt on screen. So we are primarily interested in ISR4 and onward.
Visualizing Sniffer Traces
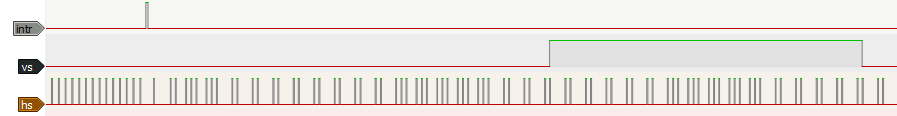
We’ve decoded and visualized sniffer traces several different ways now, from using sigrok PulseView to Excel. But there’s one thing we haven’t done. Since all the logic we are working with is centered around the CGA, it would make sense to visualize events from the sniffer trace as if they were points on a virtual screen.
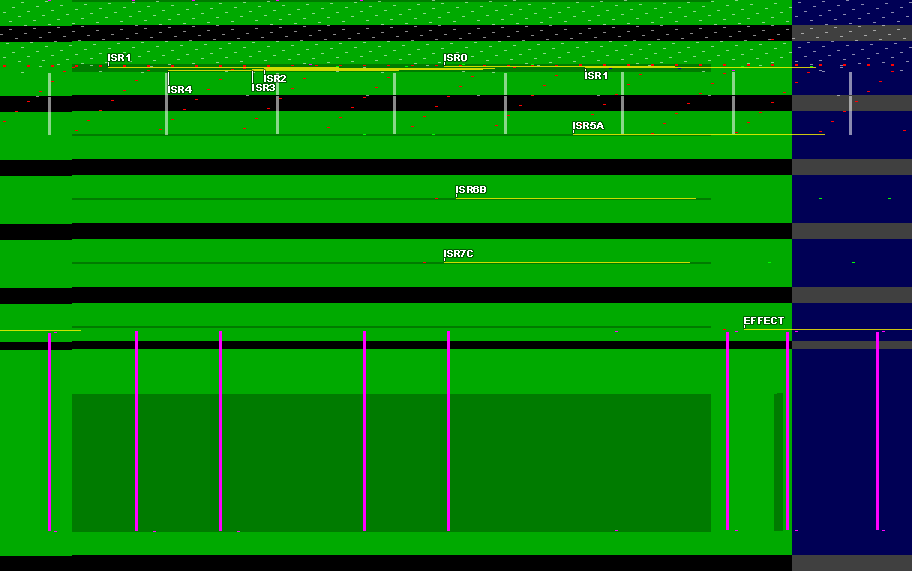
Turns out, this is fairly straightforward. Since we have captured VSYNC and HSYNC signals, we can write yet another Python program that emits an image (912 hdots / 3) pixels wide, by the total number of HSYNCs long. For each CPU clock rising edge, we can tick our ‘pixel clock’ forward, wrapping at the horizontal edge of the image. We can detect certain events, and then at the bare minimum, emit pixels that mark and differentiate said events.
I’m not going to show all the code here; it’s long and this post is long enough as it is. It will be all available at a link at the bottom of this article, anyway. It produces an image something like the following.
From Emulator to Analyzer
Looking at the decoded output of our bus sniffer is cool and all, but it’s only particularly useful if we can somehow compare it to what our emulator is actually doing, and our emulator produces cycle logs in a custom text format.
But what if we added a new cycle log format that emitted signals that our logic analyzer needed – the 20 address lines, 3 bus status lines, 2 queue status lines, INTR, READY, VSYNC, HSYNC and Display Enable (DEN)?
        if let Some(video) = self.bus().video() {
            let (vs_b, hs_b, den_b, brd_b) = video.get_sync();
            vs = if vs_b { 1 } else { 0 };
            hs = if hs_b { 1 } else { 0 };
            den = if den_b { 1 } else { 0 };
            brd = if brd_b { 1 } else { 0 };
        }

        // Segment status bits are valid after ALE.
        if !self.i8288.ale {
            let seg_n = match self.bus_segment {
                Segment::ES => 0,
                Segment::SS => 1,
                Segment::CS | Segment::None => 2,
                Segment::DS => 3
            };
            self.address_bus = (self.address_bus & 0b1100_1111_1111_1111_1111) | (seg_n << 16);
        }

        // "Time(s),addr,clk,ready,qs,s,clk0,intr,dr0,vs,hs"
        // sigrok import string:
        // t,x20,l,l,x2,x3,l,l,l,l,l,l
        self.trace_emit(&format!(
            "{},{:05X},1,{},{},{},{},{},{},{},{},{},{}",
            self.t_stamp,
            self.address_bus,
            if self.ready { 1 } else { 0 },
            q,
            s,
            0,
            if self.intr { 1 } else { 0 },
            if matches!(self.dma_state, DmaState::Dreq) { 1 } else { 0 },
            vs,
            hs,
            den,
            brd
        ));
It takes a bit of massaging, since our emulator didn’t really care about modelling physical pin states before. We have to write the status bits and the value of the data bus back to the address bus at the appropriate times. Here a nice convenience feature of PulseView comes in handy; it can interpret hexadecimal notation as packed signal lines; so we don’t need to decompose our address bus into 20 different fields. We simply need to give the format type ‘x20’ for our address column.
We also had to model the READY signal – doing it sort of backwards: on real hardware, the READY line determines wait states, but for purposes of this log format I use the calculated wait states to set the READY line.
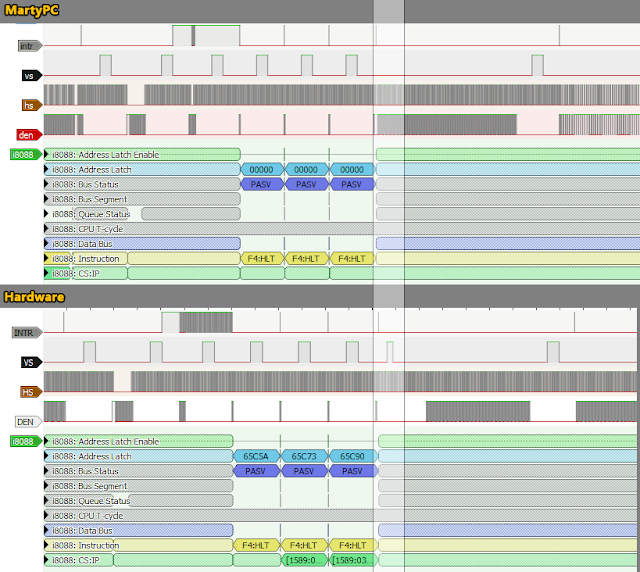
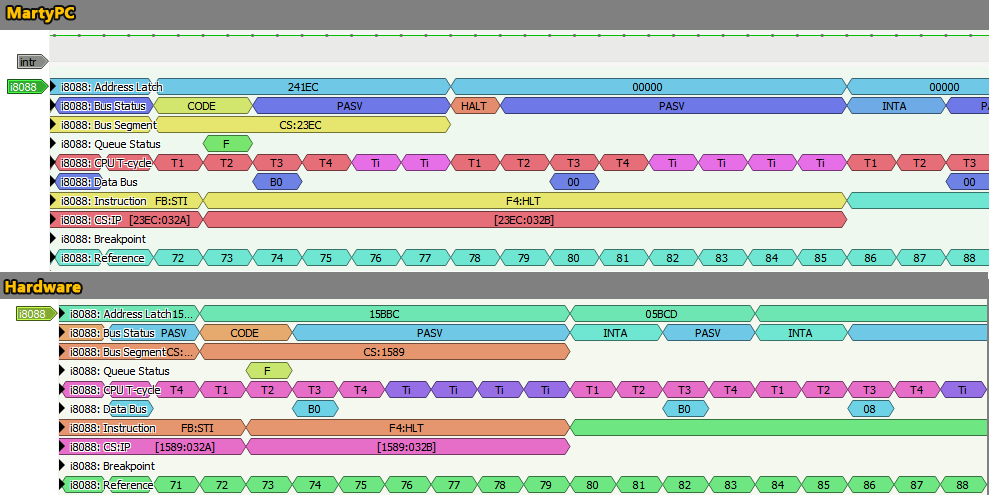
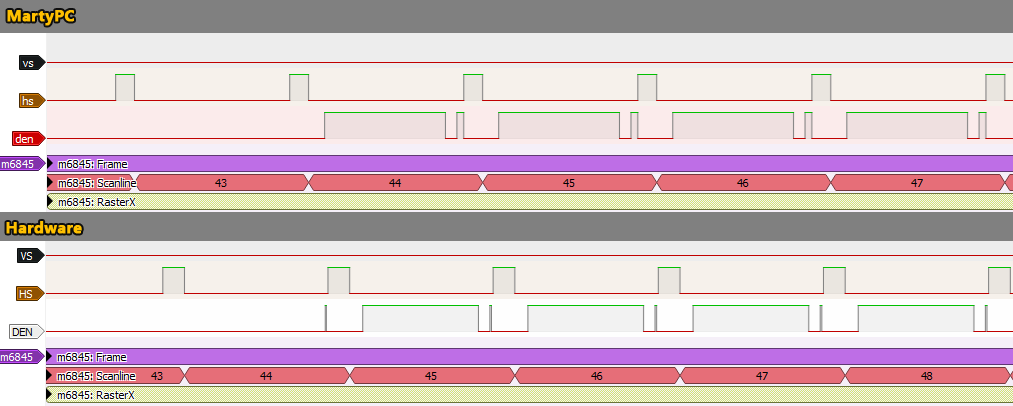
All that’s left is to poll the video device each cycle, and spit out a line of CSV each cycle, then we can import it into PulseView, and do some mostly-direct comparisons. Here we have MartyPC on the top and the hardware capture on the bottom:
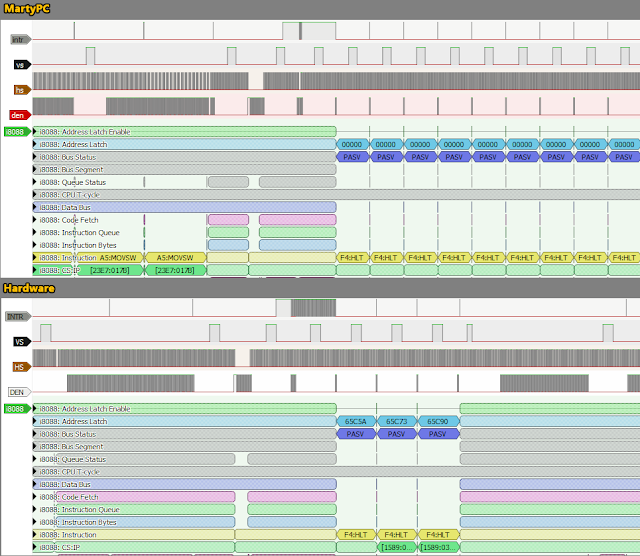
Turns out it is very hard to get exactly the same zoom level on two captures of differing lengths in PulseView; but we can get close enough. Everything seems to be going along more or less similarly until we see MartyPC halting for several long periods, where the hardware only does three. Zooming in shows us the problem is in ISR5a. ISR5a performs a read of the CGA status register, and sets up ISR6b if, and only if, DEN is low. If DEN is active, ISR5a halts again, and it will execute multiple times until enough skew occurs that DEN switches off.
Let’s look at where MartyPC misses this poll:
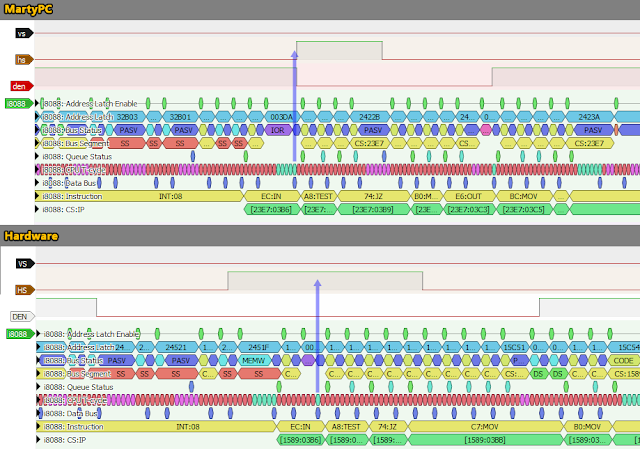
I’ve marked with arrows the very cycle on which the IN instruction reads the CGA status register. The hardware hits it spot on – polling right in the middle of our horizontal sync period. Notice that DEN is low for a period before and after HSYNC, too. This represents the entire border area plus HSYNC.
At first glance, it looks like MartyPC missed the poll by just a hair, but if we notice, DEN was actually high right up until HSYNC, when it should have been low for a period before. Moreover, HSYNC itself appears a bit too short. What’s going on?
Fixing Bug #1
In comparing our logs it’s important to note that MartyPC doesn’t have access to updated video state information on every cycle. Typically, we only advance the state of devices after an instruction has completed – or in the case of an IN or OUT, we advance the state of the device to match the cycle on which the actual bus operation completes. Since we’re only updating the CGA device after each instruction, that makes our video signals in PulseView a bit unevenly aliased compared to the real thing, but that still doesn’t explain what happened here.
The key is that this IN instruction is the first instruction in an ISR – it happened immediately after a hardware interrupt. MartyPC, like hardware, runs interrupts after an instruction completes. However, it doesn’t update device state after an interrupt. Unfortunately that meant that when the IN instruction executed, and advanced the CGA device state, it only advanced it by 8 cycles, instead of the 86 cycles it should have. Essentially, the cycles spent executing the interrupt routine itself were “lost time” from a device perspective.
Fixing this was simple. When we step the CPU, we add any cycles spent executing any immediately preceding interrupt, like so:
    pub fn step(
        &mut self,
        skip_breakpoint: bool,
    ) -> Result<(StepResult, u32), CpuError> {

        self.instr_cycle = 0;
        self.instr_elapsed = self.int_elapsed;
Fixing Bug #2
With that fixed, we now pass ISR5a’s status check like the hardware does, and we only see the expected three long halts (ignore the address latch). But shortly after, there’s something a bit odd again. The hardware performs a VSYNC that MartyPC does not. This also happens to be right at IP 0400, or the start of the actual demo effect ISR.
What’s even weirder is that this VSYNC is only 8 scanlines tall:
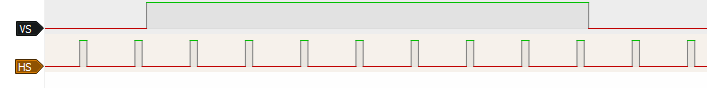
That’s a bit odd, isn’t it? The Motorola 6845 CRTC did not have any official means of controlling the height of a VSYNC. By default, VSYNC lasts for 16 scanlines, always.
There’s key bit of information here required to understand what is going on, and I thank VileR for clueing me in. The CRTC doesn’t count a new scanline at HSYNC, like I naively assumed. It counts them when the Horizontal Character Counter reaches the value of R0 (Horizontal Total). In normal operation, you’d expect these to have a 1:1 correlation – we perform an HSYNC, draw the left overscan, then reach Horizontal Total. But it’s entirely possible to suppress HSYNC, and rapidly reprogram the CRTC during a single scanline to reach Horizontal Total not once, but twice – thus ticking through the VSYNC period twice as fast. From the CRTC’s perspective, 16 scanlines would have elapsed!
The way that the Lake effect stacks logical rows side-by-side causes this double-counting. But first we’ve got to ask an important question – why did MartyPC not do a VSYNC at all?
The 6845 is basically a fancy counter – it increments certain internal counters like the Vertical Character Counter, the Horizontal Character Counter, the Vertical Line Counter, etc., and compares them to the values programmed into what are commonly known as the “CRTC Registers”, accessible on the CGA via ports 3D4 and 3D5. Most of these comparisons are tests for equality, not greater than or less than. That means if you can somehow trick the CRTC into missing a comparison, the value in the counter can overflow.
We can overflow on the vertical axis, as well. If your vertical character counter is happily ticking away, and you say, set R4 (Vertical Total) to 1, effectively placing it behind the current count, then nothing will end a frame until the vertical character counter wraps back around again, although at some point we might reach the value of R7 (Vertical Sync Position) and perform a vertical sync.
That’s exactly what has happened here, as we can see from this zoom into our video trace:
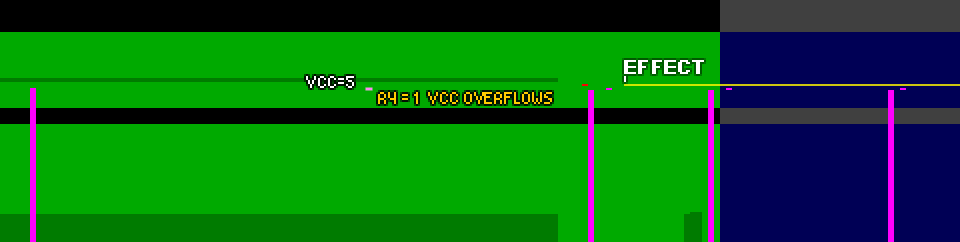
R4 (Vertical Total) is set to a value less than the Vertical Character Counter at this point; so the Vertical Character counter will just keep ticking, until we hit the value of R7 (Vertical Sync Position).
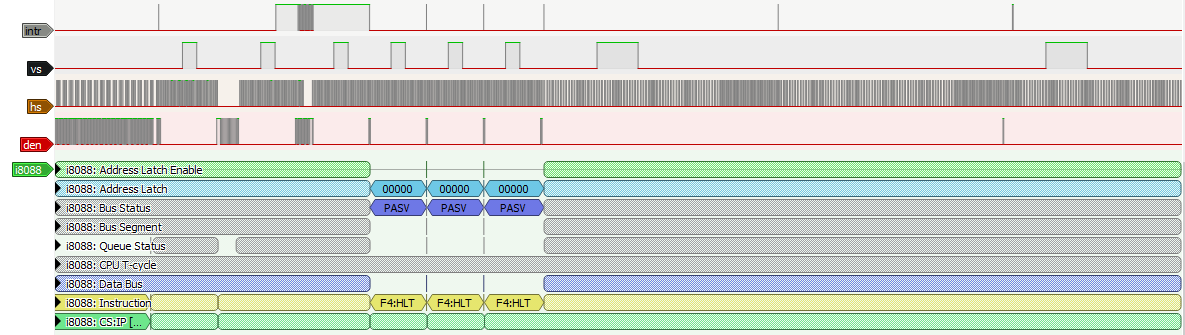
MartyPC for some reason isn’t letting VCC overflow. Lets see if we can spot why:
            if self.vcc_c4 >= (self.crtc_vertical_total + 1)  {
                // We are at vertical total, start incrementing vertical total adjust counter.
                self.vtac_c5 += 1;

                if self.vtac_c5 > self.crtc_vertical_total_adjust {
                    // We have reached vertical total adjust. We are at the end of the top overscan.
Spot it? There’s a greater-than comparison here, meaning VCC will never be allowed to be greater than R4+1, and thus overflow can’t happen. That means VCC can’t reach R7, and the VSYNC doesn’t happen.
While we’re fixing our CRTC logic, we need to make sure that we are counting scanlines toward the end of VSYNC at the end of Horizontal Total, not the end of HSYNC, too. If we did it correctly, we should be able to log an 8-scanline VSYNC at the appropriate time in MartyPC:
Well, we have a VSYNC at least, but instead of being the half length VSYNC we wanted, we’ve made it even longer! But there’s no need to panic. This is a result of the effect being unstable – the ISR landed at the wrong spot, and so the timings are off, and consequently the register-reprogramming is out of sync with the CRTC. Things get very unpredictable when that happens. Just look at these erratic HSYNC timings, a sure sign of Horizontal Character Counter overflow:
It’s hard to draw conclusions from this. We also know that if we can get the effect to start at the right position on screen, the effect is stable. Let’s take stock, and make a list of checkpoints and the raster position that occurs at each on hardware and on MartyPC, and see where we start to get out of sync. This assumes that there is some starting point where the hardware and MartyPC are synced up. This is most likely to occur after a polling loop for a new frame.
To accomplish this, we need some sort of shared frame of reference. At first the video card signals seem promising, but MartyPC struggles to emit accurate video signals due to the instruction-level aliasing issue. The best thing might be to pick a breakpoint after a VSYNC or DEN synchronization has been performed; and count CPU cycles from there.
Let’s add a feature to our decoder’s breakpoint functionality. We’ll use an asterisk before the address to indicate that a breakpoint should become a reference point – when we hit a reference point, we’ll begin counting from 0, incrementing each CPU cycle and emitting ‘Ref’ annotations with the current count.
So for example,
100:START,263:DEN1,*31E:DEN2,32C:ISR0
Will indicate that the breakpoint 31E should also be interpreted as a reference point. The decoder will then start counting cycles, emitting annotations in a Reference row:
Since we’ve messed around with annotations, all the colors have changed on us. Alas, PulseView chooses the colors for us, so there’s not much we can do but adapt to the new color scheme.
31E is as good a reference point as any – it’s the end of a Display Enable polling loop. We can simply check the reference annotation at each interrupt and see when we’re getting out of sync, and by how much. And it doesn’t take long – the very next interrupt fires off at cycle reference 80 on hardware, but
reference 86 in MartyPC.
Fixing Bug #3
It’s pretty easy to spot where our extra cycles are – they’re in the HLT instruction:
A little bit of unexpected behavior is exposed here – if the INTR line is high, as it is here, HLT doesn’t appear to actually halt the CPU – we just proceed directly into the interrupt. MartyPC wastes 6 cycles transitioning to the halted state and waking back up from it. The actual timings of the HLT instruction are an interesting topic for investigation. I spent many hours here testing the interplay of INTR and HLT, and the situation is more complicated than it might seem.
HLT’s complications don’t just extend to the actual halting process, either. The state the BIU is in when the system halts determines how many cycles it takes to wake back up. Thankfully the difference is only a single cycle, so getting this exactly perfect may not be critical, but I intend to ultimately emulate the system in a cycle perfect way, so more research must be done.
For the moment, we can assume that INTR will be high when HLT executes, or we’ll ignore it. We won’t be handling the situations where INTR goes high in the few cycles immediately after, as there’s only a 2-3 cycle window where “weird things” happen, and our timer interrupts here are not in any danger of producing such an overlap.
But waking up from a halt is trickier. We want to be able to wake from the halted state very precisely – as that is how our effect begins. The most accurate way to do this would be to tick the CPU once while it is halted, and then update every device by 3 system clock ticks, and then check for interrupts. This gives us the finest device granularity we can hope for. And for a while, MartyPC did exactly that.
The issue is that now being halted causes a huge dip in emulator performance, since our CPU and device update loop is executing a single cycle at a time. It makes slower PCs unable to run the emulator at full speed, and ruined performance of the wasm build, as well.
As a compromise, I made each loop through the CPU while halted spend three cycles, which means devices are updated for 9 system ticks after each ‘iteration’ of HLT. That’s still a reasonably short window, but it means that our effect interrupt will only be accurate within 9 hdots.
A possible way to address this situation is to use information gleaned from the timer to dynamically control the precision of HLT. If we know that timer channel 0 is over a certain threshold, we can safely execute much larger blocks of cycles during the halted state, as we know we won’t be woken up (ignoring for the moment any other interrupt sources) within that block. Once the timer value is below a certain threshold, we can switch to cycle-precision, so that HLT wakes up on precisely the correct tick.
There’s another option as well. We already have a system for synchronizing the CPU with DRAM refresh DMA – we have events and a scheduler for timer channel 1 since we need to detect terminal count on channel 1 with cycle precision. We simply could expand this event and scheduler system to timer channel 0 as well.
Progress…
We’re getting reasonably close, now. In fact the Lake effect will occasionally now start in a recognizable form:
The first two lines there might catch your eye – they are a duplicate of the bottom two rows. The water effect is accomplished by tweaking the start address for each line within the bottom half of the display. This address is still latched by the time we return the top of the next screen, and so we get two scanlines of water. The effect should be resetting the start address prior to this, but we have somehow missed the window.
As it turns out, it is more important for the stability of the effect for the interrupt to trigger at the correct column, than it is to hit the right scanline in the wrong spot. There are a few such early scanlines in which you can be “inaccurate enough to work”, albeit with these little glitches. That’s no good though, we want to be glitch-free!
Fixing Bug #4
An analysis of where we are when the effect ISR fires for the first time looks good at first glance – the INTA cycle begins at the latter end of scanline 26 (the first frame of this effect is a little delayed, but should sort itself out by the next frame). A short, 1 character wide frame should begin at the end of scanline 44, and then the first full scanline of the effect on scanline 45.
MartyPC is starting the effect an entire scanline too early – and it’s missing the short frame that starts things off. The question is why.
As it turns out, this is a somewhat interesting situation where vertical total (R9) was set to a value less than the vertical character counter (VCC) – and the vertical character counter is allowed to overflow. Vertical Total is set to 1 to produce the “stacked frames” effect that Lake uses to build its screen, but VCC is well beyond this at this point, so just keeps counting. When does it wrap? I thought it safe to assume that it’s a 7-bit counter, since we know that the Vertical Total register (R9) is 7-bits. If we wrap at an 8 bit value, the effect starts much later than it should. So 7 bits seems about right, we just have to explain where we are losing a scanline.
One immediate sign that something is odd is that in graphics modes, we will reach a VCC of 127 – the maximum value. My logic for detecting the end of of a frame was to check if VCC == R9 + 1 after incrementing VCC. However, if we limit VCC to 7-bits, then it becomes apparent that this check will never pass.
The CRTC actually has a bit of conditional logic that occurs at the start of a character row, when the Horizontal Character Counter is less than 2. (Why not just at 0, I couldn’t speculate). If the current VCC == R9 at the beginning of the row, then an internal “last line” flag is set. Then, when the current row has scanned out to the maximum height of the row, this flag is used to either increment VCC or reset it to 0. This cleverly avoids the overflow problem. During Area5150’s active effect time, we already discussed how the effect produces two CRTC frames per scanline – since we reach Horizontal Total twice, this “last line” check also occurs twice.
Time Passes, or Fixing Bug #28
You may have noticed that I have skipped a few numbers. I was writing this blog article as I went with the goal of documenting everything I had to do to fix Area 5150.
It turns out that the process was a bit more lengthy than I had originally anticipated. It has now been nearly a full year since I typed up Bug #4.
I ended up just putting my head down, going to work fixing what needed to be fixed without making a writeup of everything I did. I’m not sure if there were actually 28 bugs to be fixed, but it feels like we’re somewhere in that ballpark.
So we’ll skip to the end. What was the final bug to be fixed? It has to do with the 5150’s DMA logic.
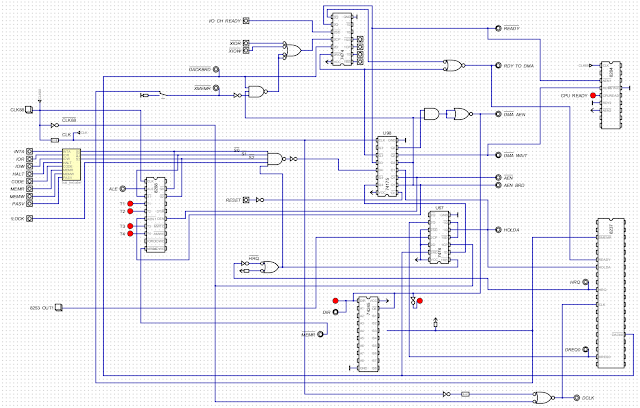
The 5150 has rather complex circuitry for generating wait states for IO, DMA, and DRAM refresh DMA:
 |
| The IBM 5150’s wait state generation circuitry. |
I had modelled the process of DRAM refresh DMA fairly accurately, but what I was missing was an accurate model of what happens when the DRAM refresh DMA cycle overlaps wait states produced by IO and the ISA bus (relevant when discussing the CGA as the CGA introduces its own wait states).
 |
| A simulation of the 5150’s wait state generation circuitry |
Creating this model involved creating simplified models of some of the miscellaneous chips. Here’s my circuit for the 8237 DMA controller:
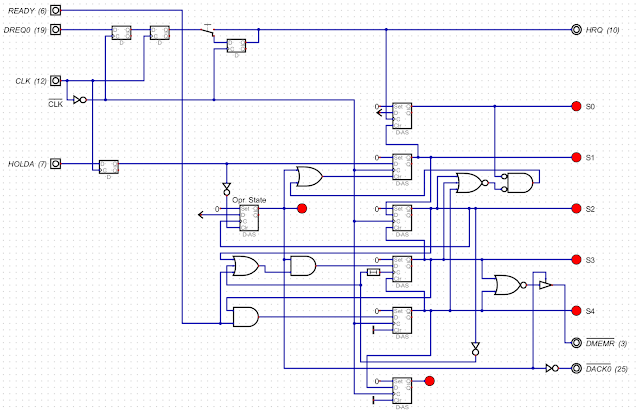 |
| A simplified model of the Intel 8237 |
You get the idea. Using this model I was able to toggle the various CPU and bus status lines that I saw in my hardware bus traces, and verify that the model produced matching output. I was then able to do the same with my emulator traces, and see where the model disagreed.
It turns out it disagreed in a single cycle where IO and DRAM refresh DMA cycles overlap – which when repeated over hundreds of cycles, was enough to knock the effect out of alignment. A bit anticlimactic, perhaps, after going through all that work to model the circuitry and chips. But it’s one cycle I wouldn’t have known about, otherwise.
Hack Free At Last
It felt very satisfying to tear out MartyPC’s timer hack. When I first implemented it, I saw adjustments on the order of 6000 ticks – now, after doggedly addressing every inaccuracy seen in bus sniff comparisons, MartyPC hits the effect interrupt within 0-2 cycles from the hardware trace.
It is just about two years after I uploaded the YouTube video of MartyPC running Area 5150, and to my knowledge, MartyPC is still the only emulator capable of running the Lake effect. I hope this article has given you some insight into why. The level of absolutely fanatical precision required is not something a lot of people have the time for, and justifying going to all the effort just to run a single demo may be a hard proposition to swallow.
If you’d like to learn more about the rest of the demo’s effects, you can watch this talk I gave at VCF Midwest 19 in 2024: